
The pair is trading into a clearly defined bearish order block, with price consolidating just below the 159.80-160.00 area. This zone has become the key decision point for the near-term direction, with market structure leaning toward a bearish continuation if the rejection holds. Analysis from Eagle Pips Pro highlights this area as a textbook supply zone where sellers are likely to reassert control.
This area is being watched as a potential sell zone where bearish continuation could begin if the level holds.
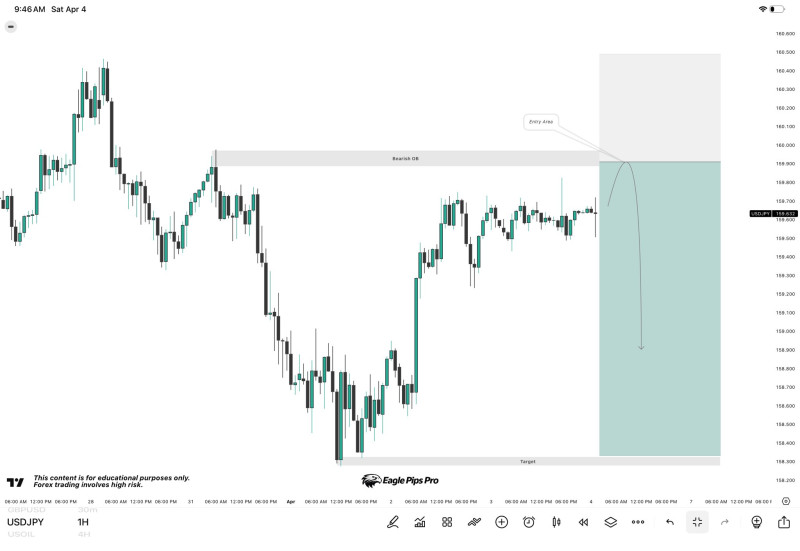
USD/JPY Enters the 160 Sell Zone, Buyers Lose Steam
The chart highlights a bearish order block sitting just under the 160 level. Price has rallied into this zone after a prior move lower, but the reaction has been muted rather than impulsive. Candles are compressing near resistance instead of pushing through, which suggests that supply is absorbing buying pressure rather than getting overwhelmed by it.
This is a classic pattern at high-interest zones - buyers run out of momentum before they can flip the level into support, and the balance tips back toward sellers.
USD/JPY Structure Points to Rejection After the Pullback
The move higher lacks strong follow-through, and price is stabilizing just beneath the order block. There are early signs of rejection already forming:
- Price struggling to hold above 159.80-160.00
- No clean breakout beyond resistance
- Consolidation forming at the top of the range
Structure is showing rejection after the pullback - the move higher lacks the kind of momentum needed to shift the bias.
This aligns with the broader technical picture: pullbacks into resistance, not breakout attempts, tend to set up the cleanest short entries when structure supports the trade.
Downside Path to 158.00 Defined by Key Levels
If the order block holds, the setup outlines a clear bearish roadmap. The projected move points to a stepwise decline through several nearby levels:
- Initial move toward 159.00
- Continuation toward 158.50
- Extension toward 158.00
Recent market behavior supports this read. A similar rejection near 160 previously led to a drop toward the 158.80 region, with sellers regaining control after failed upside attempts. History at this level has been consistent - buyers struggle to hold gains, and the area continues to act as a ceiling.
A move above 160.30 would break the bearish setup and shift the structure toward upside expansion - until that happens, price remains capped beneath resistance.
The chart defines invalidation clearly: a sustained break above 160.30 changes the picture. Until that happens, the current structure favors downside continuation, with the pair trading in a tight range beneath a major supply zone where the next meaningful move will be decided.