Marina Lubimova
The Truflation chart tracks Brent crude oil futures, WTI crude oil futures and U.S. CPI gasoline prices from January through October 2026.
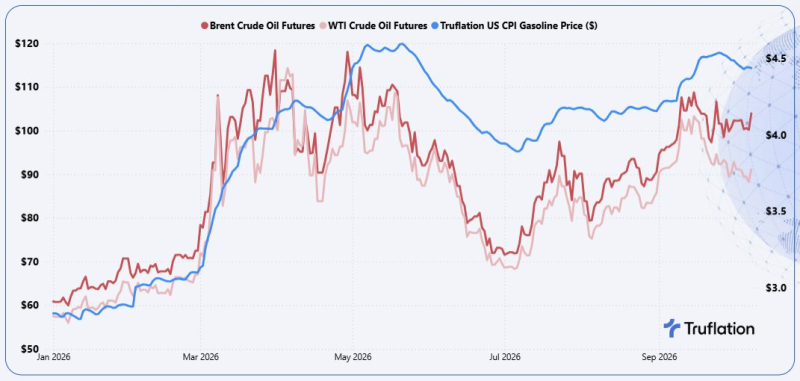
The chart uses two scales: crude oil prices in dollars per barrel on the left and gasoline prices in dollars per gallon on the right.
| Indicator | January 2026 | 2026 peak | October 2026* |
| Brent crude futures | ~$61/bbl | ~$118/bbl | ~$103–106/bbl |
| WTI crude futures | ~$59/bbl | ~$114/bbl | ~$89–94/bbl |
| U.S. gasoline | ~$2.9/gal | ~$4.6/gal | ~$3.8–3.9/gal |
*Approximate values read from the chart.
Compared with January, Brent is up roughly 70%, WTI about 55%, while gasoline is approximately 30% higher.
What changed during 2026
From January through February, Brent and WTI mostly traded between $60 and $70 per barrel, while gasoline remained close to $3 per gallon.
The strongest move came between March and May:
- Brent briefly approached $120 per barrel.
- WTI rose above $110 per barrel.
- Gasoline climbed to around $4.50–$4.60 per gallon.
All three then declined into July. Brent and WTI fell toward the low-$70s, while gasoline dropped below $4. From August, however, their paths began to diverge.
Crude recovered faster than gasoline
Brent returned above $100 per barrel in September and remained around that level into October. WTI also recovered, although less strongly.
Gasoline did not return to its May high. Instead, the indicator fell back toward $3.8–$3.9 per gallon. The key change in the second half of 2026 is the weakening link between the crude oil recovery and U.S. gasoline prices.
In spring, the pattern was straightforward:
Crude oil ↑ → Gasoline ↑
By autumn:
Crude oil ↑ → Gasoline flat or ↓
Brent vs. WTI
The gap between Brent and WTI also widened. At the beginning of the year, the two benchmarks traded only a few dollars apart. By October, the chart shows Brent roughly $10–15 per barrel above WTI.
| Period | Brent | WTI | Approx. spread |
| January | ~$61 | ~$59 | ~$2 |
| May peak | ~$118 | ~$114 | ~$4 |
| October | ~$103–106 | ~$89–94 | ~$10–15 |
The wider spread indicates that Brent has strengthened considerably more than the U.S. benchmark.
Why gasoline can diverge from crude
Crude oil is a major input cost, but it is not the only factor affecting gasoline prices. The final price also reflects:
- refining margins and refinery utilization;
- gasoline inventories;
- seasonal fuel specifications;
- transportation and distribution costs;
- taxes and regional supply conditions.
As a result, a $10 increase in crude does not automatically produce a proportional increase in retail gasoline.
Bottom line
The chart shows two different periods in 2026. During the spring rally, Brent, WTI and gasoline moved sharply higher together. In the second half of the year, that relationship weakened.
By October, Brent was again above $100 per barrel and WTI near $90–95, while gasoline remained roughly 15% below its May peak.
The main takeaway is therefore not simply that oil prices are high. It is that crude oil has recovered much more strongly than U.S. gasoline prices.
 Marina Lubimova