Marina Lubimova

The latest one-year chart showed the market yield at 5.457%, close to the WI level.
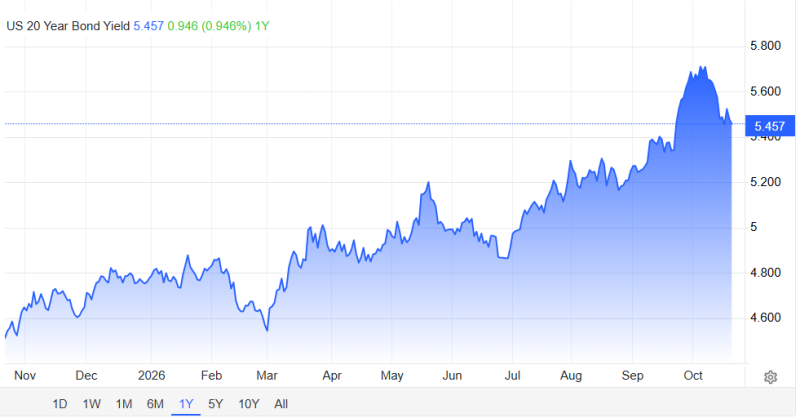
Chart 1. U.S. 20-year Treasury yield. The latest reading is 5.457%, after an October peak near 5.7%.
Yield Moves Into the Auction Near 5.46%
The 20-year yield was around 4.55–4.60% in November 2025, fell back toward 4.55% in early March 2026, and then moved higher.
Key levels from the chart:
- March-April: ~5.0%
- May: ~5.2%
- August-September: above 5.3%
- Early October: ~5.65–5.70%
- Latest: 5.457%
The current yield is roughly 90 basis points above its early-November 2025 level.

Inside the $13 Billion Sale
| Specification | October 2026 Auction |
| Security | U.S. Treasury 20-year bond |
| Offering size | $13 billion |
| WI yield | 5.460% |
| Market yield | ~5.457% |
| Coupon | 5.125% |
| Maturity | August 2046 |
| Auction date | October 21, 2026 |
The market yield is about 33 basis points above the 5.125% coupon, implying a below-par bond price.
What Changed Since the Previous Auction
| Metric | Current | Previous |
| Offering size | $13B | $13B |
| Yield | 5.460% WI | ~5.42% |
| Change | +4 bp | — |
The current WI yield is about 4 basis points above the previous auction yield.
A final auction yield above 5.460% would indicate a tail; a yield below 5.460% would indicate a stop-through.
From About 2% to More Than 5%
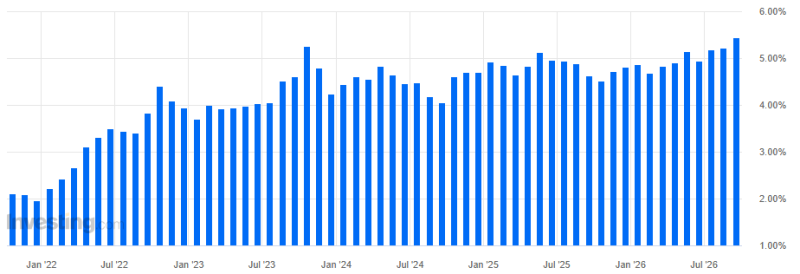
Chart 2. U.S. 20-year Treasury yield since 2022. The yield has risen from roughly 2% to around 5.4–5.5%.
| Period | Approximate Yield |
| Early 2022 | ~2.0–2.5% |
| Mid-2022 | ~3.1–3.5% |
| Late 2022 | ~4.0–4.4% |
| 2023 | ~3.7–5.2% |
| 2024 | ~4.1–4.8% |
| 2025 | ~4.5–5.1% |
| 2026 | ~4.6–5.5% |
The current yield near 5.46% is roughly 340 basis points above the level seen at the start of 2022.
5.460% Is the Key Auction Benchmark
The WI yield sets the pre-auction reference point.
- Below 5.460%: stop-through, stronger demand
- Around 5.460%: auction in line with expectations
- Above 5.460%: tail, weaker demand
Example:
WI 5.460% → auction 5.490% = 3 bp tail
Numbers to Watch After the Auction
The main indicators are:
- High yield versus 5.460% WI
- Bid-to-cover ratio
- Indirect bidder share
- Primary dealer allocation
A high indirect share and low dealer take generally indicate stronger end-user demand.
Current Market Context
The two charts show the same repricing across different periods. Over the past year, the 20-year yield rose from around 4.6% to 5.46% and briefly approached 5.7%.
Since early 2022, it has increased from roughly 2% to more than 5.4%. The auction therefore comes with long-term Treasury yields near the upper end of their recent range.
Key Levels
- 5.460% — pre-auction WI yield
- 5.457% — latest market yield on the chart
- ~5.42% — previous auction yield
- ~5.7% — recent October peak
- $13 billion — auction size
A stop below 5.460% would signal stronger demand. A clear tail above that level, especially with a high dealer allocation, would point to weaker demand for long-duration Treasury debt.
 Marina Lubimova