Zeta Global Holdings Corp (ZETA) has drawn attention from technical analysts following a chart setup that maps out a long-term bullish wave structure. With the stock trading near $16, the projected upside targets sit considerably higher, making the setup one of the more watched setups in the current market environment.
Wave Structure Points to $66 as the Next Major Target
The technical picture for ZETA stock is built around a multi-wave Elliott Wave count. After completing what analysts label as Wave 2 - a decline into the $11-$12 support zone - the stock has been grinding through a consolidation phase in the $16-$17 range. Fibonacci levels are mapped across this range, with 0.618 sitting near $17.01 and 0.786 at $11.26.
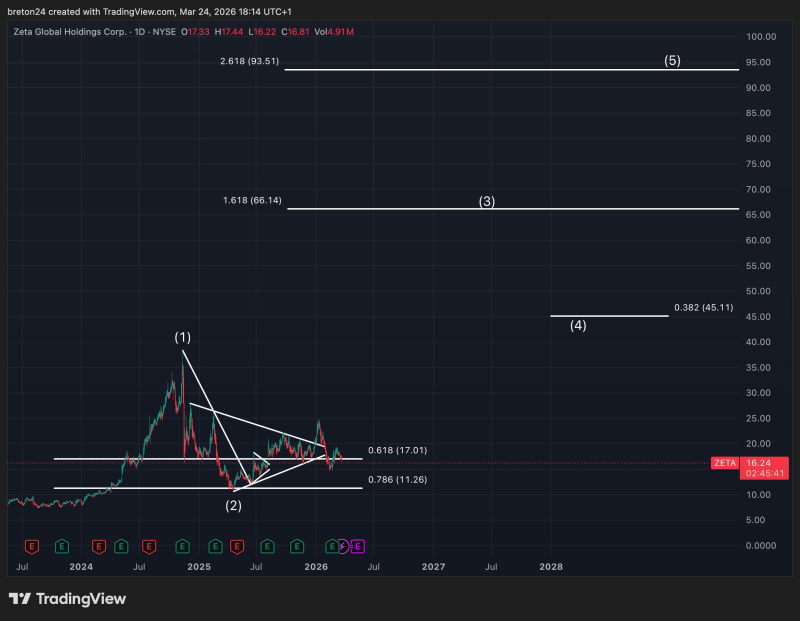
The next projected move is a Wave 3 push toward $66, which aligns with the 1.618 Fibonacci extension from the current base. This extension level is widely used in Elliott Wave analysis to project the magnitude of impulse moves, and the $66 target reflects the standard measured objective for a third wave advance.
Long-Term Bull Case: 2.618 Extension Puts Wave 5 Near $93
Beyond the Wave 3 target, the broader count extends to a Wave 5 objective near $93 - corresponding to the 2.618 Fibonacci extension. This longer-term target reflects the full completion of the five-wave impulse sequence, assuming the structure plays out as outlined.
It is important to note that this remains a projection based on chart structure. The current consolidation near $16-$17 is framed within this framework as a setup phase before a potential expansion. Zeta Global operates in the data-driven marketing technology space, and its fundamental outlook may influence whether the technical scenario gains traction. For now, the chart-based case rests on the wave count holding above the Wave 2 low near $11-$12.