Marina Lubimova
The core federal mechanism is the Federal Railroad Administration’s Consolidated Rail Infrastructure and Safety Improvements program, or CRISI.
For FY2025–26, FRA lists $2.039 billion available for award under the CRISI Notice of Funding Opportunity. That means the broader $2.3 billion headline should not be treated as identical to the CRISI funding pool.
FY2025–26 CRISI: key specifications
| Parameter | Specification |
| Funding available | $2.039B |
| Maximum federal share | 80% |
| Minimum rural allocation | 25% |
| Rural funding reserved | At least $532.5M |
| Eligible transport | Freight and intercity passenger rail |
| Administrator | Federal Railroad Administration |
Eligible projects include track rehabilitation, bridges, sidings, grade crossings, short-line upgrades, congestion relief and multimodal freight connections.

Railroads already spend heavily on infrastructure
Class I railroad capital spending on infrastructure and equipment rose from $20.2 billion in 2009 to $30.3 billion in 2015, then fell to $24.9 billion in 2018.
| Year | Capital spending |
| 2009 | $20.2B |
| 2010 | $20.7B |
| 2011 | $23.3B |
| 2012 | $25.5B |
| 2013 | $25.1B |
| 2014 | $28.0B |
| 2015 | $30.3B |
| 2016 | $25.9B |
| 2017 | $24.8B |
| 2018 | $24.9B |
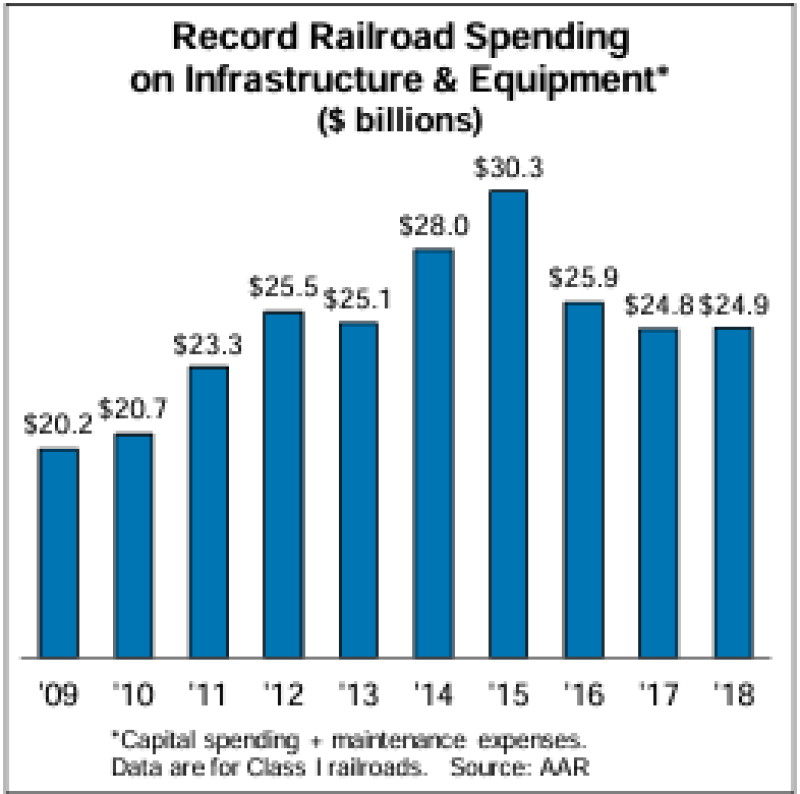
Caption: Class I railroad capital spending peaked at $30.3 billion in 2015. Source: Association of American Railroads.
This puts the federal program in context: CRISI supplements, rather than replaces, private railroad investment.
The network is smaller, but each freight car carries more
Class I system mileage declined from 99,250 miles in 2000 to 91,285 miles in 2022, a drop of about 8%.
At the same time, average freight-car capacity increased from 92.7 tons to 105.3 tons, or about 14%.
Revenue ton-miles were also above the 2000 level in 2022:
| Metric | 2000 | 2022 |
| System mileage | 99,250 | 91,285 |
| Average freight-car capacity | 92.7 tons | 105.3 tons |
| Revenue ton-miles | 1.47T | 1.53T |
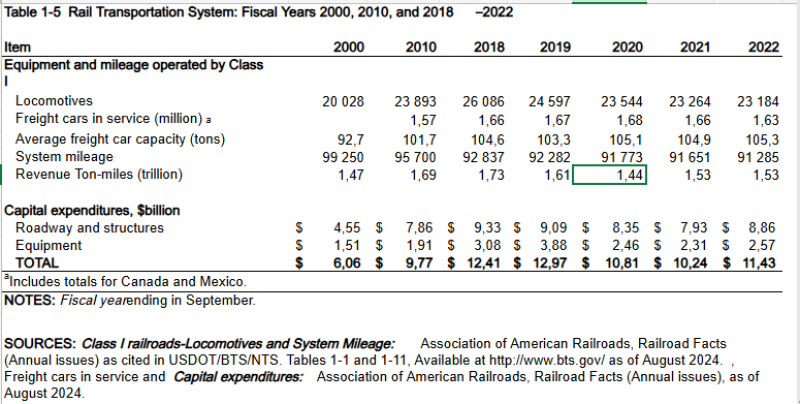
Caption: Class I rail mileage declined while average car capacity increased. Source: Association of American Railroads / USDOT BTS.
The same dataset shows $11.43 billion in Class I capital expenditures in 2022, including:
- $8.86B for roadway and structures
- $2.57B for equipment
About 78% of total capex therefore went to roadway and structures.
Why this matters for CRISI
The data point to the core infrastructure problem.
The network is carrying heavier cars over fewer route-miles, which increases the importance of:
- bridge load capacity;
- track condition;
- siding length;
- junction capacity;
- grade-crossing performance.
For many four-axle freight cars, the industry standard gross weight is about 286,000 pounds. A bridge or short-line segment that cannot support that weight can constrain an entire route. CRISI funding targets exactly these bottlenecks.
Current round vs. previous CRISI round
The FY2023–24 CRISI round had $2.478 billion available, compared with $2.039 billion for FY2025–26.
| Metric | FY2023–24 | FY2025–26 |
| Funding available | $2.478B | $2.039B |
| Change | — | -17.7% |
| Federal share limit | 80% | 80% |
| Freight eligible | Yes | Yes |
| Passenger rail eligible | Yes | Yes |
| Short-line projects | Yes | Yes |
The current CRISI pool is therefore about $439 million smaller, or roughly 18% below the previous round.
Bottom line
The important issue is not network expansion. Class I rail mileage fell from 99,250 miles in 2000 to 91,285 miles in 2022, while average freight-car capacity rose from 92.7 to 105.3 tons.
That means more freight capacity has to be extracted from existing infrastructure. The practical value of the new federal funding is therefore in fixing bottlenecks: bridges, track, sidings, crossings and short-line connections.
The goal is not necessarily more railway. It is more usable capacity from the railway already in place.
 Marina Lubimova