Candlesticks were created by Sokyu Honma, a Japanese rice trader, hundreds of years ago. Since then, they have acquired such an impressive reputation as a powerful analytical tool; they are still widely used by binary options traders today.
This is because many experienced investors currently deploy a thorough grasp of candlestick concepts to boost their profits and success. Candlesticks can generate important insights into prevailing trading conditions because each one displays a unique interpretation about how the price of an asset performed over a selected time period.
Each candlestick is represented by 4 price points: closing, highest, opening and lowest prices. The distance separating the closing and opening values is defined as the ‘body’. When the closing value is higher than the opening price, then the candlestick is bullish and its body normally has a white color. Alternatively, a bearish candlestick is formed whenever the opening price is above the closing value.
The distance separating the highest price and closing price of a bullish candlestick is known as the ‘wick’. In addition, the distance separating the lowest value and opening value is referred to as the ‘tail’.
- Sample of Bearish and Bullish Candlesticks

Since the creation of candlesticks, investors have identified a library of candlestick formations that can be easily used to detect important price movements and structures. A number of famous patterns are now presented.

I. Shaven Head – Small Body with no wick, but long tail. Indicates a Bullish reversal.
II.Spinning Tops – Small bodies with small tails and wicks. Indicates market indecision.
III. Doji – No body with just horizontal line. Indicates market indecision.
IV. Marobozu – Long body with no wick or tail. White body is bullish while black body is bearish.
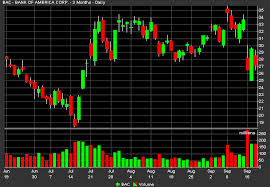
Every candlestick denotes one time period of a chosen time-frame. For example, if you select the daily time period, then each candlestick will represent a one day period displaying how the price of an asset traded throughout that time. This feature implies that a trading chart, based on the hourly time-frame and displaying price action over a number of days, will present a series of consecutive hourly candlesticks, as displayed by the following diagram. In this figure, bullish candlesticks are black while bearish candlesticks are red.

Candlesticks for Binary Options
Although most binary options brokers do not provide candlestick patterns directly, you can acquire this useful tool by subscribing to one of the many free online chart services. See our review of free charts for more information.