Marina Lubimova

The path to that high has been anything but linear. Retail activity started 2020 at roughly 0.57x the long-term average before climbing steadily above 1.10x through the summer. By December, trading volumes peaked near 1.60x, only to retreat over the following eighteen months. Throughout 2022 and much of 2023, activity rarely exceeded 0.90x, with several months falling to 0.69–0.75x, the weakest period in the series.
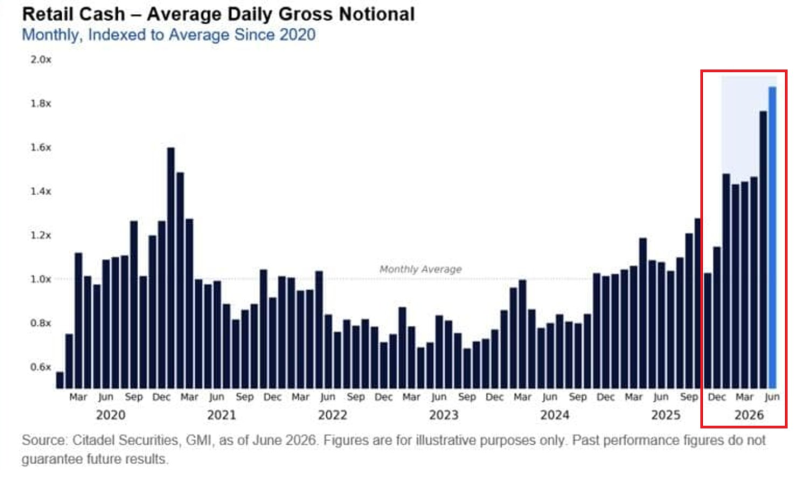
Momentum returned gradually rather than explosively. Retail trading moved back above the historical average at the end of 2024, finishing the year around 1.03x. During 2025, volumes strengthened further, generally ranging between 1.05x and 1.28x, suggesting that individual investors were becoming consistently more active instead of responding to isolated market events.
The strongest move came this year. Retail cash trading increased from approximately 1.03x in January 2026 to 1.15x in February before jumping to 1.47x in March. Activity remained elevated in April (1.43x) and May (1.46x) before climbing to 1.76x in June, the highest reading in the dataset.
Unlike the spike seen in late 2020, the current advance has been sustained over several consecutive months. Elevated participation has become the norm rather than the exception, indicating that retail investors are contributing a larger share of everyday market liquidity.

The backdrop makes the trend even more notable. The previous peak coincided with stimulus payments, near-zero interest rates and pandemic-driven speculation. Today's record has emerged despite higher borrowing costs and a far more restrictive monetary environment.
The data does not explain where the market is headed next. It does show that retail participation has expanded beyond the conditions that originally sparked it, becoming a lasting feature of U.S. equity trading rather than another short-lived cycle.
 Marina Lubimova