
Oil markets process new inventory data that shows an unclear picture for WTI crude. Domestic stockpiles grow to levels last seen more than a year ago. At the same time, refiners operate at high capacity and gasoline demand stays stable. To understand what drives the stockpile increase, one must look past the main figure.
EIA Data: 6.9M Barrel Build Pushes Stockpiles to 2024 High
The most recent EIA weekly petroleum report verified a 6.9 million barrel rise in U.S. crude inventories. This pushed stockpiles to their peak level since June 2024. The build results from strong refinery activity and a steep fall in outbound flows rather than one single supply shock. Inventory levels now move toward the upper end of the five year historical range, which signals that supply slowly exceeds near term absorption.
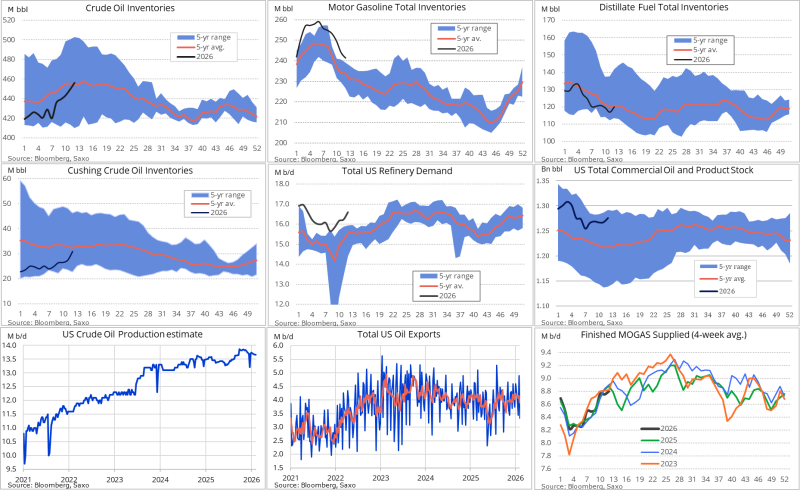
Refinery runs reached their peak since 2018, which indicates that processors draw crude with intensity. That demand has been more than offset by a 0.8 million barrels per day fall in net imports. This drop stems almost entirely from weaker exports rather than a jump in inbound supply.
Exports Hit 3.3M bpd Low as Cushing Stocks Rise for 5th Straight Week
U.S. crude exports dropped to roughly 3.3 million barrels per day, the lowest level since last November. At the same time, Cushing, Oklahoma inventories recorded a fifth straight weekly gain. This adds localized pressure on WTI futures at its main delivery hub. The combination of falling exports and rising Cushing stocks creates a typical condition for WTI to perform worse than global benchmarks like Brent in the near term.
Demand keeps the bearish thesis in check - implied gasoline consumption stays strong, with product demand indicators that show no notable decline despite higher pump prices. Refinery margins stay stable and end users do not lower consumption in a way that would indicate broader demand destruction.
The overall picture for WTI involves competing forces - rising domestic stockpiles and a weakening export outlook create overhead pressure. Strong refinery throughput and steady fuel demand provide a floor. Until export volumes recover or Cushing draws begin to appear, the path of least resistance for WTI prices tilts slightly lower relative to global crude benchmarks.