Marina Lubimova

Recession talk has moved from background noise to something markets are actively pricing. Prediction markets are now assigning roughly a 37% chance of a recession this year, clearing the 30% threshold that Goldman Sachs had cited as its own estimate. That gap between Wall Street's model and real-money market pricing is worth paying attention to.
Walter Bloomberg flagged the development, and the chart structure behind it reinforces that this isn't just a sentiment spike.
Recession Probability Breaks Above 30% and Holds as New Market Floor Forms
The setup through late February and early March looked contained. Probabilities were fluctuating in the low-20% range, forming a relatively stable base without much directional pressure. Then mid-March arrived, and the structure broke higher.
Once the chart moved above 30%, it did not revisit previous levels. That indicates a change in how risk is being priced, not just a temporary spike in sentiment.
That's the key distinction here. A spike that reverses looks like noise. A spike that holds and then builds higher lows looks like a regime change. What the chart is showing right now falls into the second category: the ~30% level has flipped from resistance into support, and pullbacks since the breakout have been shallow.
- Stable base near 22-25% through late February
- Sharp breakout into the mid-30s in mid-March
- No full retracement back into the prior range
- Higher lows forming into late March
- Current compression between roughly 32% and 37%
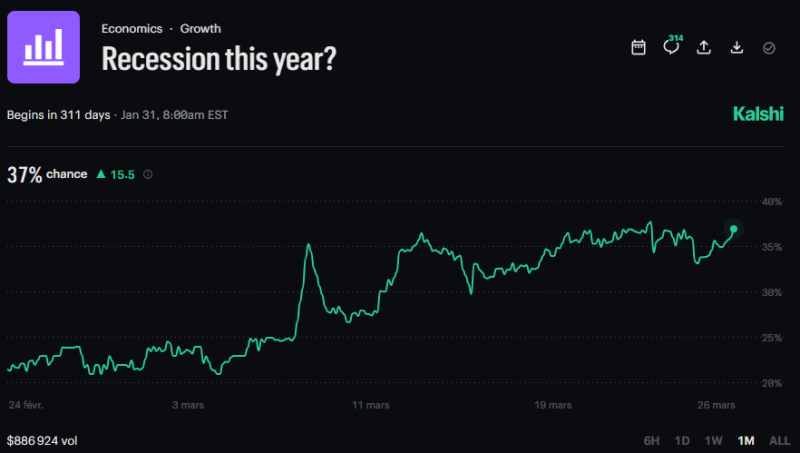
Market Recession Odds at 37% Show Persistence, Not Volatility-Driven Swings
The most recent move toward 37% puts the chart at its highest point in the observed period. What's notable is the absence of rejection at these levels. The structure isn't showing exhaustion candles or sharp reversals at the highs. It's compressing tightly near the top of the range, which typically reflects continuation rather than a trend that's about to roll over.
The move is not abrupt. It is building. Elevated recession expectations are becoming embedded rather than temporary.
That persistence is what separates this from typical uncertainty spikes. Markets price tail risks aggressively when fear peaks and then unwind just as fast. This chart is doing the opposite: absorbing each pullback at higher levels and continuing to press toward new highs in probability terms.
Recession Pricing Trend Holds as Institutional and Market Signals Align
The broader context adds weight to what prediction markets are showing. Goldman Sachs at 30% and Kalshi markets at 37% are different methodologies pointing in the same direction. When institutional forecasting models and real-money prediction markets converge on elevated recession risk, the signal is harder to dismiss as noise.
Both institutional forecasts and prediction markets are pointing toward increased recession risk. The structure reflects acceptance of a higher probability as a new baseline.
The chart's structure itself becomes the main indicator when there are no moving averages or momentum tools overlaid. And what that structure is showing is unambiguous: higher highs, higher lows, stability near the top of the range, and no breakdown below support. Those are continuation characteristics.
The move from 22% to 37% didn't happen overnight, and it hasn't reversed. That's the signal. Recession odds aren't spiking on panic. They're climbing on accumulation.
 Marina Lubimova