Marina Lubimova

Price and flow are telling two different stories in ASTS right now, and that divergence is the whole setup. The stock is attempting to stabilize, but the institutional participation data underneath it isn't backing the move. That gap between what price is doing and what algorithms are doing is where the next directional decision gets made.
Fibby shared the chart, and the structure it reveals is one of the cleaner divergence setups in recent sessions.
ASTS Stock Bounce to $95 Fails as AlgoFlow Stays Negative Throughout Rally
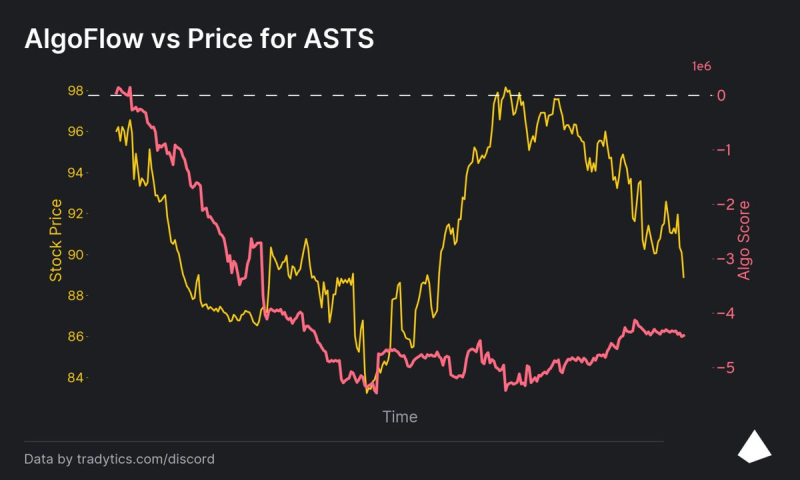
The chart shows two distinct phases. Earlier in the move, price was declining while AlgoFlow held above zero. That's a bullish divergence, the kind that signals large buyers absorbing selling pressure and building a base. That phase ended.
The structure flipped from accumulation into sustained distribution, where large participants are no longer supporting price.
What followed was a sharp drop in flow below zero, persistent selling across multiple sessions, and a price bounce that couldn't hold. That bounce toward the $95 area is the most telling part of the chart. Price staged a meaningful rebound from the mid-$80s, but AlgoFlow stayed negative the entire way up. No institutional confirmation, no sustained demand behind the move. The rally reflected short-term buying rather than genuine re-accumulation, and it reversed accordingly.
- Earlier phase: price declining, flow positive = bullish divergence
- Structure flip: flow drops sharply below zero
- Price bounces to $95, flow stays negative throughout
- Rally reverses, price falls back toward high $80s
- AlgoFlow now hovering near -5M with no recovery signal yet
ASTS Stock $84 Support Zone Becomes Key Level as Flow Deceleration Watched
The current setup centers on one level and one indicator. The $84 zone previously acted as a floor where price reversed higher, which makes it the natural reference point for what happens next. AlgoFlow sitting near -5M is the pressure reading against that floor.
The key signal will be a shift in flow behavior. A move back toward zero, or ideally above it, would indicate that larger participants are re-entering.
The setup creates a clear framework. Continued negative flow sustains downside pressure. Decelerating flow moving from -5M toward -4M or -3M signals exhaustion. Stabilization near $84 while flow begins to flatten creates the conditions for a potential reversal.
There are early signs the pace of decline in flow is slowing slightly, but slowing and reversing are different things. Until flow actually turns, the structure remains fragile regardless of what price does.
ASTS Stock Next Move Depends on Flow Confirmation, Not Price Action Alone
That framing reframes the whole setup. Most traders watch price. This chart is saying price is the lagging variable. What happens in AlgoFlow in the next few sessions, whether it continues grinding near -5M or starts recovering toward zero, is the actual leading signal.
A recovery in flow that precedes or accompanies a hold at $84 would mirror the earlier accumulation phase that set up the initial rally. The absence of that flow recovery would suggest the $84 floor is more vulnerable than it looks on price alone.
Right now ASTS is in the zone where the structure could either set up or break down. Price is attempting to stabilize. Flow hasn't confirmed it. The divergence is still intact, and until it resolves, the balance remains tilted toward caution.
 Marina Lubimova