Marina Lubimova

Gold has shifted its technical structure after breaking below a well-defined ascending channel, signaling a move away from its prior trend. According to Gold Predictors, price has found support near $4,300 and is now attempting a rebound, with $5,250 emerging as the key level that will determine whether recovery can continue.
The Breakdown That Altered Gold's Structure
The chart shows gold trading within a rising channel for an extended period, maintaining a sequence of higher highs and higher lows. This structure defined the uptrend until price failed to hold higher levels and broke below the lower boundary.
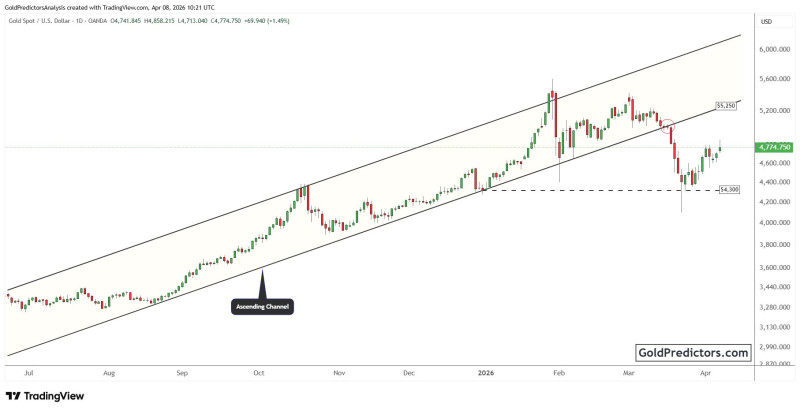
That breakdown marks a clear shift. The channel is no longer intact, and the market has transitioned into a different phase where prior support dynamics no longer apply.
Why $4,300 Became Gold's Support Base
After the breakdown, price declined and found support near the $4,300 level. This area is clearly marked on the chart and represents the point where selling pressure slowed.
The channel is no longer intact, and the market has transitioned into a different phase where prior support dynamics no longer apply
The reaction from this level suggests that buyers stepped in, allowing price to stabilize and begin a rebound. This aligns with similar technical scenarios where gold finds interim support after structural breaks before attempting recovery moves, as seen in Gold Holds Channel Support as Uptrend Stays Intact.
The $5,250 Resistance That Now Defines Recovery
As price rebounds, attention shifts to the $5,250 level, which is now acting as resistance. This level corresponds to the prior channel structure and represents the area where price previously failed.
A move above $5,250 would indicate that price is regaining strength and could shift the structure back toward recovery
The transition of this zone from support within the channel to resistance above it reflects a typical technical shift after a breakdown. Similar setups have shown gold struggling at key resistance zones before confirming direction, as highlighted in Gold Tests $4,800 Resistance as Trap Scenario Builds.
The Condition for Recovery Remains Clear
The chart outlines a straightforward structure:
- Support established near $4,300
- Price attempting a rebound
- Resistance defined at $5,250
A move above $5,250 would indicate that price is regaining strength and could shift the structure back toward recovery. Until that happens, the rebound remains incomplete.
This type of setup often leaves markets in a transitional phase, where price action remains uncertain until a key level is reclaimed - similar to the conditions described in Gold Tests $5,000 as Price Action Signals Uncertain Momentum.
 Marina Lubimova