Marina Lubimova

Gold is trading at a decision point after a sharp recovery from support near $4,495, where price found demand and reversed higher. As market analyst Itsadiee_Fx noted, sellers were initially trapped as bearish pressure gave way to strong buying momentum, triggering a breakout above the previous weekly high - a level that had held firm for several weeks.
The move reflects a clear shift in short-term sentiment, though the broader structure still points to a two-sided market. Both buyers and sellers remain vulnerable depending on how price behaves around current resistance.
Once price clears a key weekly high, buyers tend to enter aggressively - but that breakout energy can become a trap if the level fails to hold on a retest.
Gold Breaks Above Weekly High Near $4,600
The moment price moved above the prior weekly high, market behavior shifted noticeably. Buyers entered aggressively, changing the tone from neutral to slightly bullish and confirming a structural break.
The Gold futures surge above $4,800 following this breakout attracted layered participation - some traders entered early off the initial move while others waited for further confirmation higher. That dynamic built momentum and carried price toward the $4,800 zone.
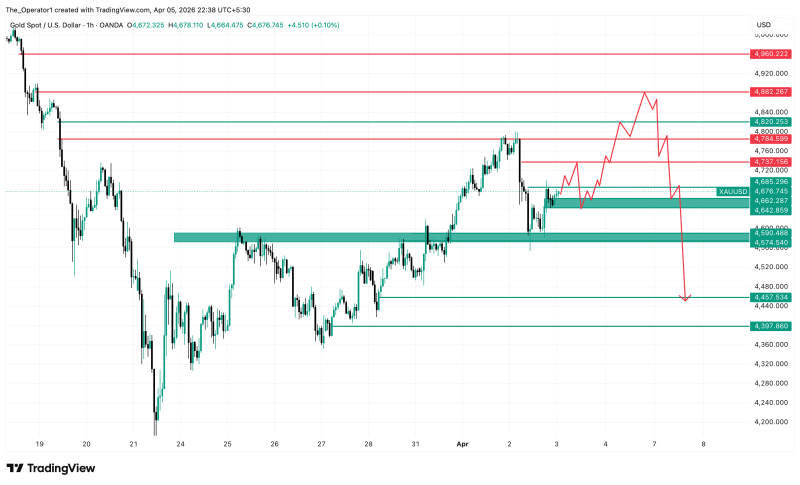
Gold's $4,737-$4,750 Zone: The Level Every Trader Is Watching
The $4,737-$4,750 region stands out as a key reaction area. Historically, this zone acted as resistance and previously triggered a sharp downside move, making it a reference point for traders on both sides of the market.
A rejection here could bring sellers back in, particularly if price stalls below $4,800. This would set up a temporary pullback that reintroduces bearish positioning into an otherwise bullish-looking structure.
Resistance that produced a major move in the past rarely goes unnoticed the second time around - it tends to attract the most aggressive reactions.
The current setup outlines a specific sequence worth tracking:
- A stable or slightly bullish market open
- A short-term rejection near $4,737-$4,750
- Sellers entering based on perceived resistance
- A potential move higher that challenges or breaks $4,800
This pattern creates conditions where early sellers may get trapped first, only to be followed by late buyers if price eventually reverses.
Gold at $4,800: Where the Trap Scenario Plays Out
The broader gold liquidity picture in 2025 adds context to the current setup. If price breaks above $4,800 and later falls back below $4,737, it could trigger a sharp and sustained downside move as breakout buyers become trapped.
That scenario reinforces the two-sided nature of this structure - momentum looks bullish on the surface, but the setup carries meaningful reversal risk for anyone entering late.
A break above major resistance followed by a swift reclaim to the other side is one of the cleanest trap scenarios in technical trading - it catches breakout buyers and reactive sellers alike.
The gold price action near $5,000 adds a longer-term dimension: the broader analysis still anticipates a potential move back toward the $4,500 region or lower, suggesting the current rally may not yet represent a sustained breakout.
Gold remains positioned at a critical inflection point. How price responds to resistance in the $4,737-$4,800 range will likely determine whether momentum extends or reverses sharply in the sessions ahead.
 Marina Lubimova