Marina Lubimova

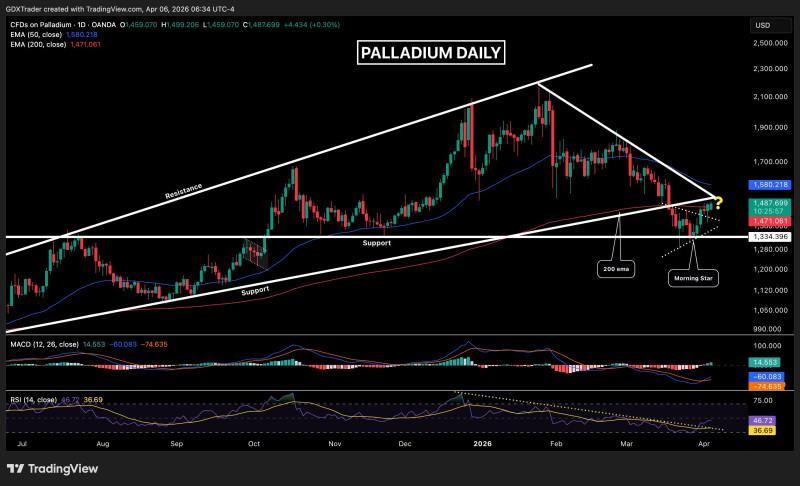
Palladium is attempting to build upward momentum after a clear reaction from support, with price now pressing into a key technical resistance area. According to GDXTrader, the move follows a bullish morning star pattern, signaling a shift from selling pressure toward emerging demand - but the chart is now approaching a decisive level.
The reversal that sparked the palladium move
The chart shows a bullish morning star forming at horizontal support, marking a turning point after a period of decline. This pattern reflects a transition in control, where sellers lose momentum and buyers begin stepping in at a defined level.
Following that signal, price action turned constructive, with multiple continuation candles confirming that the initial reaction was not isolated. This aligns with broader palladium price analysis, where reactions at key support zones often define short-term direction even within volatile structures.
The move follows a bullish morning star pattern, signaling a shift from selling pressure toward emerging demand - and the chart is now approaching a decisive level.
Palladium tests strength around the 50 EMA
After the rebound, palladium encountered resistance just below the 50 EMA, where a spinning top candle formed - signaling hesitation and short-term profit-taking. However, this pause was brief. A bullish continuation candle followed, reclaiming the 50 EMA and reinforcing the developing strength in palladium price action. This reclaim is a key technical shift, indicating that buyers are gaining confidence in the short term.
At the same time, momentum indicators are beginning to improve, with the MACD crossing above its signal line - a signal that often accompanies early-stage trend transitions.
A bullish continuation candle reclaimed the 50 EMA, reinforcing emerging strength - buyers are gaining confidence and momentum indicators are beginning to shift in their favor.
Where palladium structure meets supply
Price is now testing a technically significant confluence zone. The chart shows palladium approaching prior support from an ascending broadening wedge, which may now act as resistance, alongside a descending trendline pressing from above. This creates a clear decision area. Similar setups in recent palladium technical analysis show that when price approaches former support turned resistance within wedge structures, volatility tends to expand and direction becomes decisive.
Two scenarios are now in play:
- If price breaks and holds above this zone, it signals strength and opens the path toward the 200 EMA overhead - a major trend reference that could define the next phase of price action
- If rejection occurs, the market may pause or pull back as it absorbs recent gains
When price approaches former support turned resistance within wedge structures, volatility tends to expand - and the next directional move often becomes decisive.
Momentum builds, but the palladium test isn't over
The recent price behavior reflects improving sentiment, with buyers stepping in on dips and maintaining upward pressure. At the same time, the chart shows that palladium remains within a broader structure where resistance has not yet been cleared. This balance between strengthening momentum and overhead supply places the palladium market at a critical inflection point - one where the next move will likely be defined by how price reacts at this resistance zone.
 Marina Lubimova