Artem Voloskovets

Earlier in the session, spot gold traded at $4,145.68, down 0.8%, while U.S. gold futures were at $4,173.50.
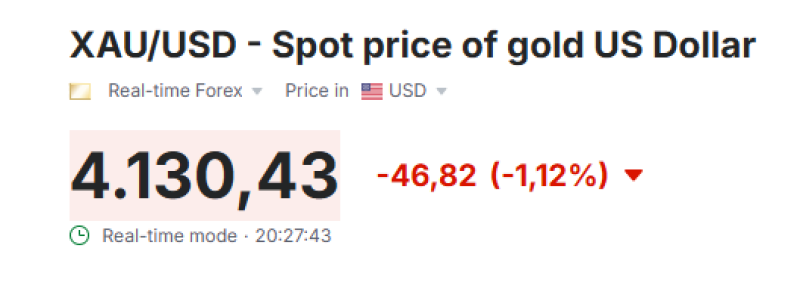
Caption: Spot gold trades near $4,130 per ounce, down more than 1% on the session.
Market Snapshot
| Metric | Value |
| Spot gold | $4,137.85/oz |
| Real-time chart price | About $4,130/oz |
| Session move | Nearly -1% |
| U.S. gold futures | $4,173.50 |
| Trading symbol | XAU/USD |
| Troy ounce | 31.1035 grams |
Comparison With the Previous Session
Spot gold was around $4,165 per ounce on October 1.
At $4,137.85, that implies:
- about $27 lower per ounce;
- roughly -0.7% versus the previous reference price.
| Metric | October 1 | October 2 |
| Spot gold | ~$4,165 | $4,137.85 |
| Change | — | About -$27 |
| Percentage change | — | About -0.7% |
The headline move of nearly 1% uses a different intraday reference point.

What Is Driving Gold Lower
Three factors are pressuring the market:
- High Treasury yields increase the opportunity cost of holding non-yielding gold.
- A strong U.S. dollar makes gold more expensive for buyers using other currencies.
- Federal Reserve expectations remain restrictive despite weaker U.S. economic data.
Weak payroll data initially pushed gold higher, but the move reversed as bond yields remained elevated.
Gold Is in a Broader Correction
The latest decline is part of a larger move. Gold recently traded above $4,600 per ounce before falling back toward $4,130.
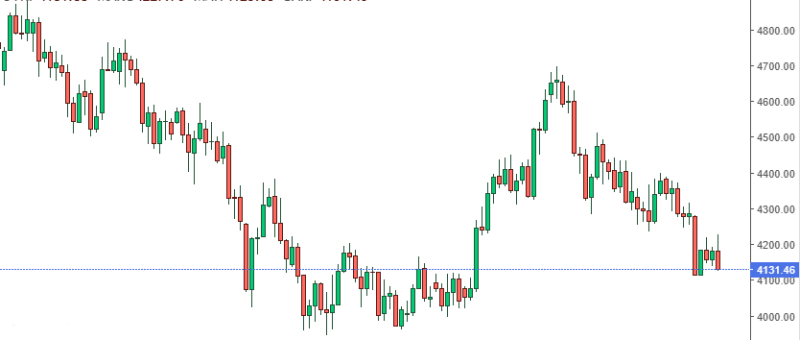
Caption: Spot gold has fallen from recent highs above $4,600 to around $4,130 per ounce.
The chart shows:
- rejection from the $4,600-$4,700 area;
- repeated weakness below $4,400;
- a move back toward $4,100.
From roughly $4,650 to $4,130, gold has lost about $520 per ounce, or around 11%.
Key Technical Levels
| Level | Significance |
| $4,100 | Immediate support |
| $4,000 | Major psychological support |
| $4,200 | Near-term resistance |
| $4,300-$4,400 | Previous consolidation zone |
| $4,600-$4,700 | Recent major resistance |
A break below $4,100 would put the $4,000 level back in focus. A recovery above $4,200 would ease some short-term pressure.
Cross-Market Context
The main signals to watch are:
| Indicator | Impact on gold |
| Treasury yields rising | Negative |
| Treasury yields falling | Positive |
| U.S. dollar strengthening | Negative |
| U.S. dollar weakening | Positive |
| Fed turning more dovish | Positive |
| Fed remaining restrictive | Negative |
Bottom Line
Spot gold at $4,137.85 is down nearly 1% on the session and remains in a broader correction from recent highs above $4,600.
The immediate technical range is now $4,100-$4,200. Below that, $4,000 is the next major support level. Above it, $4,200 is the first level gold needs to recover to reduce short-term downside pressure.
 Artem Voloskovets