Marina Lubimova

Tesla is drifting lower after a recent rally, but the nature of the move is drawing attention. Analyst Cantonese Cat noted that the sell-off is unfolding on relatively low volume - a dynamic that suggests reduced conviction rather than aggressive distribution.
TSLA Pulls Back Into Mid-$300s Support Zone
The chart shows TSLA retreating from recent highs into a clearly defined support zone around the mid-$300s. Price is not collapsing - instead, it is gradually retracing into an area that previously acted as a base.
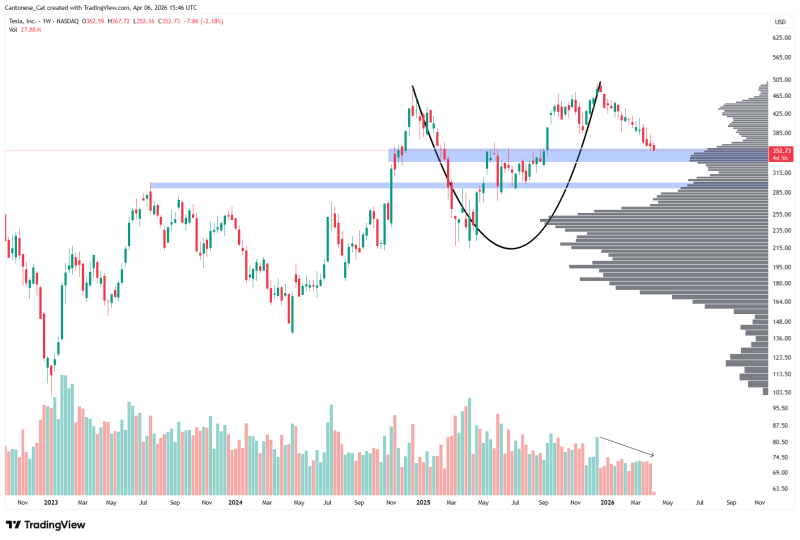
The sell-off is unfolding on relatively low volume - a dynamic that suggests reduced conviction rather than aggressive distribution.
This type of price action typically reflects a corrective phase rather than a structural breakdown. Broader technical data also shows TSLA trading in a weak short-term trend, with multiple indicators leaning bearish, even as momentum approaches oversold territory.
Why Volume Matters for TSLA Right Now
What stands out most is the declining volume during the pullback. The chart highlights a steady reduction in participation as price moves lower. This aligns with a classic technical behavior:
- Selling pressure weakens as price declines
- Participation drops during the move
- No clear expansion in volume to confirm a breakdown
Such conditions often indicate that the move is not being driven by strong sellers, but rather by a TSLA critical trendline test - where a lack of buyers stepping in aggressively defines the outcome.
Selling pressure weakens as price declines - participation drops and no clear volume expansion confirms a breakdown.
TSLA Structure Remains Intact Despite Decline
Despite the pullback, the broader structure remains unchanged. Price rallied strongly before this decline and is now testing a prior support zone rather than breaking below it. This keeps the setup neutral-to-constructive from a technical perspective, as long as the current zone holds.
Further analysis also points to the $340-$350 region as a key technical area where price may stabilize, with downside risk increasing only if that zone fails.
The $340-$350 region is a key technical area where price may stabilize - downside risk increases only if that zone fails.
The Decision Zone: What Happens at TSLA Support
At this stage, TSLA is defined by one key factor: how price reacts at support. The setup can be summarized simply:
- Price pulling back into support
- Volume declining during the move
- No confirmed structural breakdown
For now, the chart reflects a market in transition - not a confirmed reversal, but a test of whether the prior structure can hold under continued selling pressure. Traders watching Tesla stock key support levels will find the next few sessions critical in determining the direction of the next significant move.
 Marina Lubimova