Marina Lubimova

Tesla now sits in a narrow price band where repeated sell offs meet a stack of ceilings overhead. Analyst Ryan Mallory notes that the share price faces multiple barriers packed within a few points - any short lived bounce could stall almost right away.
Declining Trendline Caps TSLA's Upside Around 384
A downward sloping line links the past peaks and presently presses on the market at about 384. Each upward move has failed beneath that line - the larger slide stays in place. Until the price settles above 384, the first barrier remains intact.
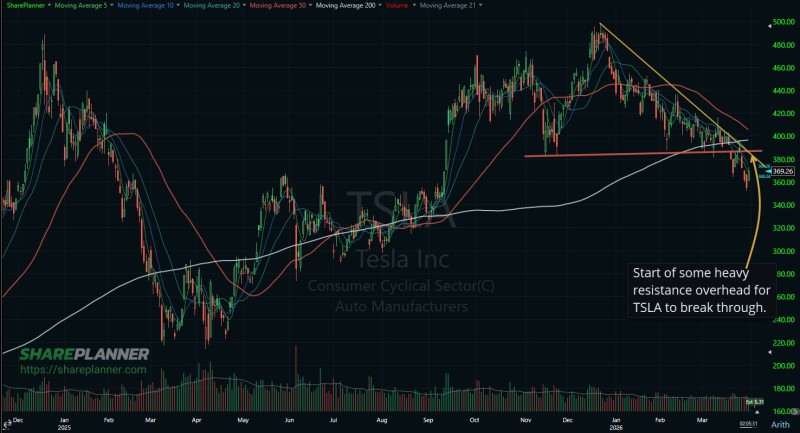
Above that line the obstacles multiply - a fixed horizontal ceiling waits near 388 and only one point higher the 200-day mean price line adds a third hurdle. Three separate barriers now crowd the zone between 384 and 390 - even a lift from stretched low levels would meet instant pressure.TSLA Remains Below the 200-Day Moving Average
TSLA Remains Below the 200-Day Moving Average
The 200-day average is a main long term reference or Tesla trades under it. That position shows the downward pull is long term, not fleeting and it caps attempted rallies. The average overhead confirms the situation is not a routine rebound but a sequence of tests.
Daily and weekly gauges show the stock is stretched to the downside. But an oversold reading alone does not promise a surge and it gives no assurance that price will defeat a down sloping line, a fixed price ceiling and the 200-day average one after another. In a layout like this, the easiest route may still be sideways or lower until the structure changes.
The present shape signals persistent technical strain - until Tesla lifts past the 384-388 block and moves back above the 200-day average, the short term view leans toward vigilance rather than bold bets.
 Marina Lubimova