Artem Voloskovets
The increase is minor. The more important development is that a facility that once absorbed more than $2.5 trillion of excess liquidity now attracts only a few hundred million dollars.
The Real Story Isn't the Daily Increase
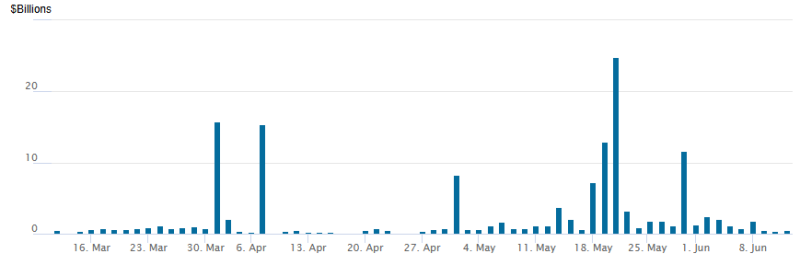
Figure 1. Daily reverse repo usage remains near zero, interrupted by occasional short-lived spikes.
Recent data show several temporary jumps in demand, including a spike to roughly $24 billion in late May and several moves above $10 billion. None of these lasted.
Most sessions remain close to zero, and participation is limited to only a handful of counterparties. The latest reading of $460 million is consistent with that pattern rather than evidence of a broader shift.
Reverse Repo Has Become a Marginal Liquidity Tool
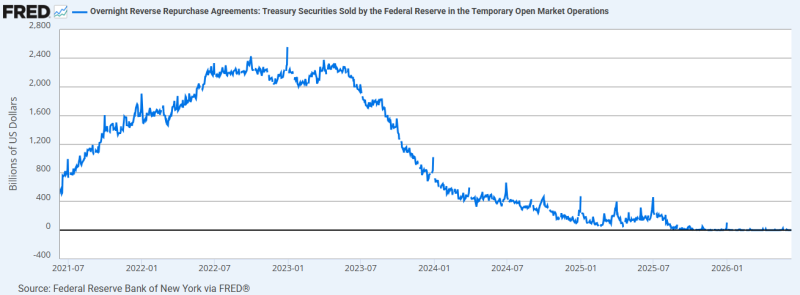
Figure 2. Reverse repo balances fell from more than $2.5 trillion in 2022–2023 to near-zero levels in 2026.
The reverse repo facility expanded rapidly during the pandemic-era liquidity surge. Balances climbed from roughly $500 billion in mid-2021 to more than $2.5 trillion by late 2022.
That cash has largely disappeared from the facility. Usage declined throughout 2023, accelerated lower in 2024, and now sits near the lowest levels since the program became a major part of money markets. Today's $460 million operation represents less than 0.02% of peak utilization.
Where the Money Went
The decline does not mean liquidity vanished. Cash moved into Treasury bills, repo markets, and other short-term instruments offering competitive yields. Increased Treasury bill issuance gave money market funds an alternative to parking cash at the Fed overnight. As a result, the reverse repo facility lost its role as the default destination for excess liquidity.
Why This Matters for Quantitative Tightening
The collapse in reverse repo balances has helped the Federal Reserve reduce its balance sheet without putting immediate pressure on bank reserves. For much of the tightening cycle, liquidity left the RRP facility first. That allowed quantitative tightening to continue while limiting its impact on the banking system. The closer reverse repo balances move toward zero, the smaller that buffer becomes. Future balance-sheet reduction may increasingly draw liquidity from reserves rather than from idle cash parked at the Fed.
Who Was Using the Facility?
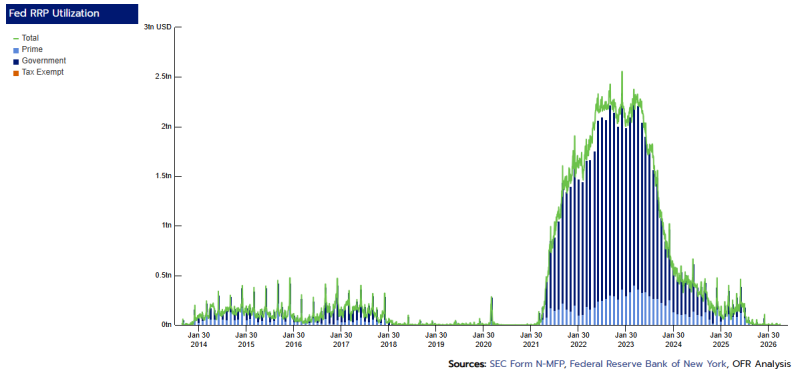
Figure 3. Government money market funds accounted for most reverse repo demand during the facility's peak.
Government money market funds generated the overwhelming majority of reverse repo activity between 2021 and 2023. At the peak, they accounted for more than $2 trillion of daily balances.
As Treasury bill supply increased and yields became more attractive, those funds steadily reduced their use of the facility. The decline in their participation explains most of the drop in aggregate balances.
What Markets Should Watch
The daily figure matters less than the trend.
Key indicators include:
- Reverse repo balances approaching zero.
- Treasury bill issuance.
- Money market fund allocations.
- Bank reserve levels.
- The pace of Federal Reserve quantitative tightening.
A sustained rise in reverse repo balances would signal excess cash is building again. Current data point in the opposite direction.
 Artem Voloskovets