Artem Voloskovets

The U.S. Dollar Index (DXY) is fading after a failed attempt to hold above the 100 level, with price action now drifting lower and momentum indicators turning bearish. According to analyst Kurt S. Altrichter, moves in the dollar have become a reliable signal for Bitcoin, with shifts in institutional confidence often playing out through the DXY chart before spreading elsewhere.
Movements in the dollar are closely watched as a signal for Bitcoin, with shifts in confidence often reflected through price action.
DXY Rejection at 100 Marks a Turning Point
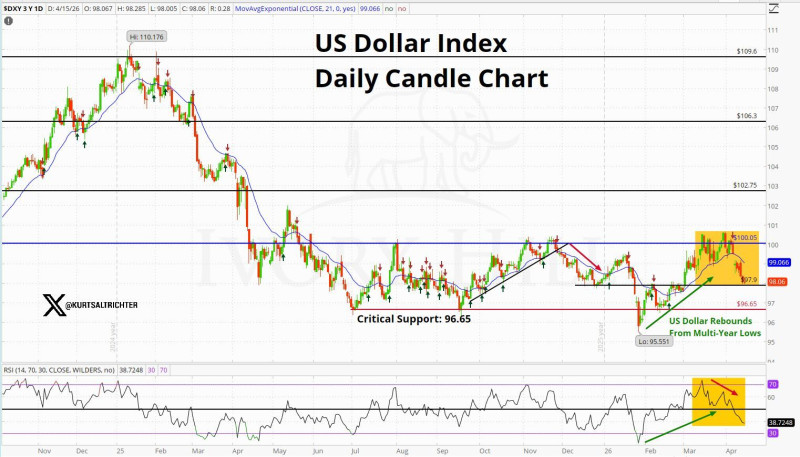
The chart shows a clean rejection near the 100 zone, where price pushed higher but could not sustain the move. That level has acted as a visible resistance area for some time, and the failure to break through it represents a short-term turning point. What followed was not a sharp reversal but a gradual drift lower, reflecting a loss of upward momentum rather than a sudden collapse. Traders monitoring the DXY chart on TradingView have noted that this kind of rejection pattern often precedes more sustained weakness.
DXY Support Levels Near 97.9 and 96.65 Come Into Focus
As the index pulls back from resistance, attention shifts to nearby support. The chart identifies a first zone around 97.9, followed by a more critical level near 96.65. These areas previously served as stabilization points and now represent potential reaction zones as price approaches them. Whether the index holds or breaks through will likely determine the next meaningful directional move. Analysts tracking dollar index trends at Investing.com have flagged the 96.65 area as particularly significant for medium-term positioning.
The current decline is approaching a key support region, placing the market near a potential turning point that bears watching closely.
RSI Signals Fading Momentum Behind the DXY Move
The RSI reading adds weight to the bearish read. After climbing during the recent bounce, the indicator is now rolling over - a behavior consistent with price failing at resistance and losing follow-through. This kind of momentum divergence, where price attempts to push higher but the underlying strength is already fading, tends to precede continuation of the downward move rather than a fresh breakout. For those tracking Bitcoin's price on CoinMarketCap, the RSI rollover in DXY is a secondary data point worth adding to the analysis.
The RSI rolling over from elevated levels aligns with the rejection at resistance and supports the view that the push higher lacked the underlying strength to continue.
Why Dollar Direction Remains a Key Signal for Bitcoin
The broader takeaway from the setup is straightforward. Dollar weakness tends to create a more favorable environment for assets like Bitcoin, which often move in the opposite direction of the greenback. The current configuration - a failed breakout, a drift toward support, and fading momentum readings - aligns with a weakening phase for the DXY. Taken together, the signals point to conditions that have historically supported Bitcoin upside, though confirmation will depend on whether key support levels hold or give way in the sessions ahead.
 Artem Voloskovets