Marina Lubimova

Hims & Hers Health (HIMS) faces a difficult period at present and technical indicators show that selling pressure remains active. Bulls must wait for the stock to decline toward a specific support zone before they discuss recovery and this process requires additional time. The charts indicate that traders should focus on the $19-$21 range.
HIMS Heads Toward $19-$21: Why the 50 %-61.8% Fib Zone Matters
HIMS now moves through a Wave 2 retracement and calculations point to a destination between $21 and $19. This area aligns with the 0.50 - 0.618 Fibonacci retracement levels - a range that technical traders monitor for potential reversals during corrective phases. When price retreats to those levels, it often signals that the correction matures rather than intensifies.
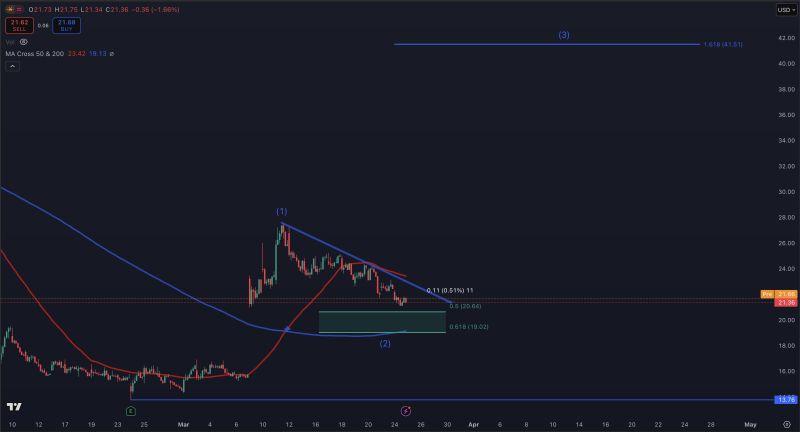
A 200-period moving average on the hourly chart rests just above $19, which adds significance to this zone. The combination of Fibonacci support and a long term moving average within the same narrow range tends to attract buyers and prepare conditions for a bounce.
From $19 Support to a $40+ Wave 3 Target - What Comes Next for HIMS
HIMS price action now hovers near the upper boundary of this support zone - additional downside remains possible before the stock reaches its full target range. The decline from recent highs matches a normal corrective phase - nothing unusual from an Elliott Wave perspective, though uncomfortable for those who hold long positions.
After HIMS establishes stability in the $21-$19 range, the Elliott Wave structure indicates a Wave 3 expansion - historically the strongest and longest move in any impulsive sequence. Upside projections for this next leg exceed $40, which would mark a substantial recovery from current levels. The critical question is whether price holds the support zone and confirms the reversal instead of breaking below it.
The setup demands patience at this stage - waiting for HIMS to complete its corrective move and demonstrate stabilization near $19-$21 before acting appears to be the wiser approach. Observe how the stock responds at those levels - that response determines whether the $40 target represents a realistic destination or merely a figure on a chart.
 Marina Lubimova