Marina Lubimova

META stock is extending its decline toward a key technical level, with price action aligning closely with a downside target outlined in the chart. As CyclesFan noted, the yearly S1 pivot near $494 - close to the prior low around $480 - now becomes the primary zone to watch.
The Breakdown That Shifted META's Structure
The chart shows META transitioning from a prior uptrend into a clear downward move. After reaching higher levels earlier, price has reversed and is now forming a sequence of lower highs and lower lows.
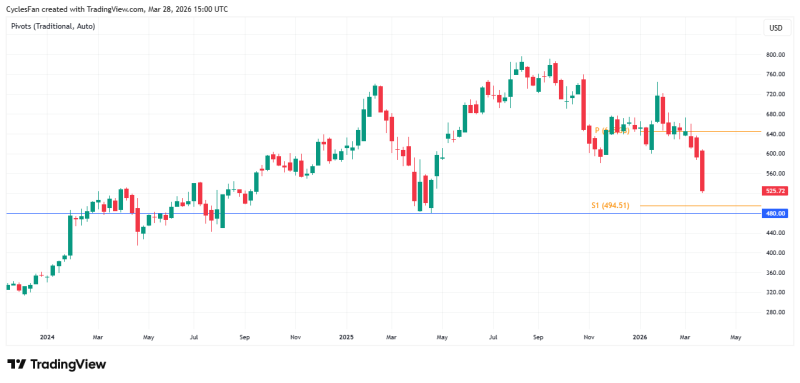
Recent candles reflect strong downside momentum, with price moving quickly from the $600+ area toward the low $500s. The decline appears direct, with limited pauses or consolidation - reinforcing the strength of the current move. From a technical standpoint, the structure is no longer neutral and is now trending lower.
Why the $494-$480 Zone Stands Out for META Stock
The key focus on the chart is the confluence between the yearly S1 pivot at approximately $494 and the prior low near $480. These two levels form a tight support zone that the current move is heading toward with momentum.
Price is approaching this area with momentum and no clear reversal signals - the zone has not yet been tested in a meaningful way.
There are no clear reversal signals yet, and the lack of visible stabilization suggests the level has not been tested in any meaningful way. The setup places this zone as the likely destination for the current move - consistent with the target outlined in the original analysis.
META Approaches a Potential Intermediate-Term Turning Point
The analysis highlights this region as a potential intermediate-term low, while also noting that META is relatively inexpensive compared to other large-cap technology stocks on a valuation basis. While the chart reflects only price behavior, the alignment between the downside move and the projected target suggests this level could act as a decision point once reached.
The alignment between the downside move and the projected target suggests this level could act as a decision point - but only once price actually arrives and shows how it behaves.
At this stage, META stock remains in a downward structure with price still moving toward the identified support zone. The next phase will depend entirely on how price behaves once the $494-$480 area is tested - whether it finds genuine demand or continues to reprice lower through what has become the most closely watched level on the chart.
 Marina Lubimova