Marina Lubimova
GBP/USD is advancing toward a key liquidity area after a period of consolidation, with price now approaching a critical resistance zone. According to The Gunslinger, the pair is expected to target liquidity above recent highs before potential short opportunities emerge.
The Displacement That Changed the GBP/USD Setup
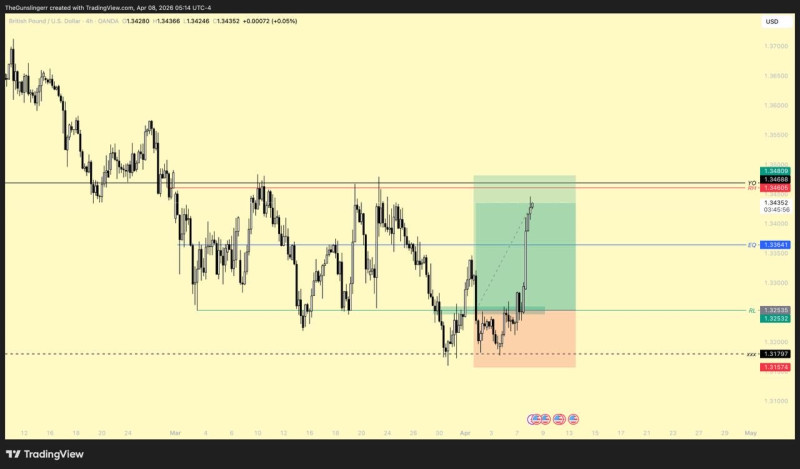
The chart shows GBP/USD reacting from a lower zone near 1.3170 and moving higher with a strong displacement candle. This move marked a shift from consolidation into expansion, pushing price toward higher levels.
Even clean zones can lead to extended drawdowns, especially during volatile conditions.
However, instead of continuing smoothly after entering the initial demand zone, price consolidated below it. This behavior reflects a broader reality in trading -
Why the 1.3460 Area Is the Key GBP/USD Level
The chart highlights a resistance zone near 1.3460, aligned with the yearly open. This level represents a key liquidity area where price is likely to be drawn before any directional move lower can develop.
Price needs to sweep liquidity above the yearly open before any short setup becomes actionable.
The expectation is that price will first move into this zone to take liquidity above it. Only after this process is completed does the setup for potential shorts become relevant.
A GBPUSD Setup Built Around Liquidity, Not Direction
The analysis does not present a simple directional bias. Instead, it focuses on how price interacts with liquidity zones and higher timeframe structures. The approach is sequential rather than predictive:
- Price targets liquidity above the yearly open level
- After that, short setups may be considered
- Until then, price can continue higher within the current move
This reflects a liquidity-driven approach, where the timing of entries depends on how price behaves at key zones rather than predicting direction in advance.
 Marina Lubimova