Artem Voloskovets

The company earned $9.78 billion from sales and it generated $1.47 in adjusted earnings for each share. The business maintained a gross margin of 23.9% - those three financial results are higher than the values that market analysts predicted.
| Q2 FY27 | Actual | Consensus | Beat |
| Revenue | $9.78B | $9.59B | +$190M / +2.0% |
| Adjusted EPS | $1.47 | $1.38 | +$0.09 / +6.5% |
| Gross margin | 23.9% | 23.5% | +40 bps |
The quarterly profits exceeded the predictions of analysts by an amount that is more than triple the percentage by which the total sales exceeded the expectations. The investors are monitoring this specific financial figure before they consider other data.
$39 Million of Extra Gross Profit
The difference of 40 basis points in the margin appears minor before the calculation includes the quarterly revenue of Best Buy. The quarterly revenue is $9.78 billion. A gross margin of 23.9% results in approximately $2.338 billion of gross profit.
The company is at a gross profit of approximately $2.298 billion if it achieves the 23.5% margin that analysts from Wall Street anticipate.
The calculation results in a difference of approximately $39 million. To state this differently, the actual profit margin exceeded the expected profit margin by an amount that created almost $40 million in additional gross profit. There is more income because the company performed better than the average predictions of financial analysts suggested.
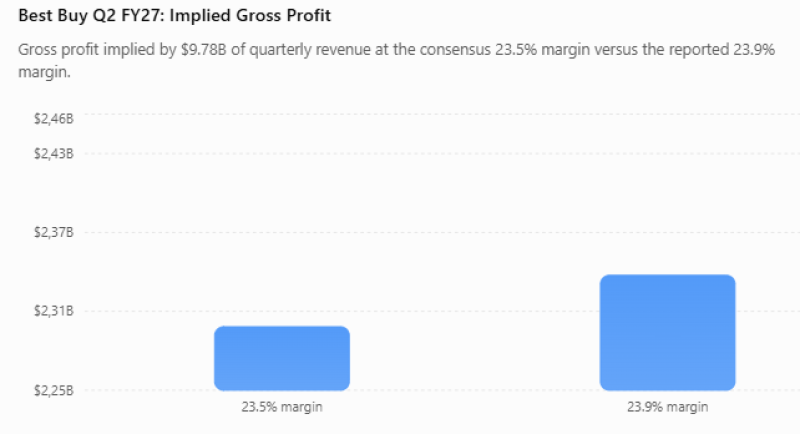
The reported revenue exceeded expectations by 2.0% and this difference accounts for the earnings per share surpassing predictions by 6.5%.
Best Buy Just Added ~$900 Million to Its Revenue Outlook
The most significant changes are in the financial projections for the entire fiscal year.
- Best Buy now expects FY2027 revenue of: $42.3B–$42.8B
- Versus the previous range of: $41.2B–$42.1B
- Using the midpoint:
Old: ~$41.65BNew: ~$42.55B
- That is an increase of approximately: +$900 million or +2.2%.
The current minimum value of the updated financial range is $42.3 billion. It is $200 million greater than the previous maximum limit - this difference is a large shift in how the executive team expects the business to perform - but the shift is not a small change near the average of the previous estimates.
Guidance Reset
| FY27 | Previous | New | Midpoint Change |
| Revenue | $41.2B–$42.1B | $42.3B–$42.8B | +$0.90B |
| Adj. EPS | $6.30–$6.60 | $6.70–$6.90 | +$0.35 |
The EPS revision is even stronger.
- Previous midpoint: $6.45
- New midpoint: $6.80
- Increase: +$0.35 / +5.4%
The company Best Buy raised the predicted earnings per share by a ratio that is two and a half times larger than the expected growth rate of the total income.
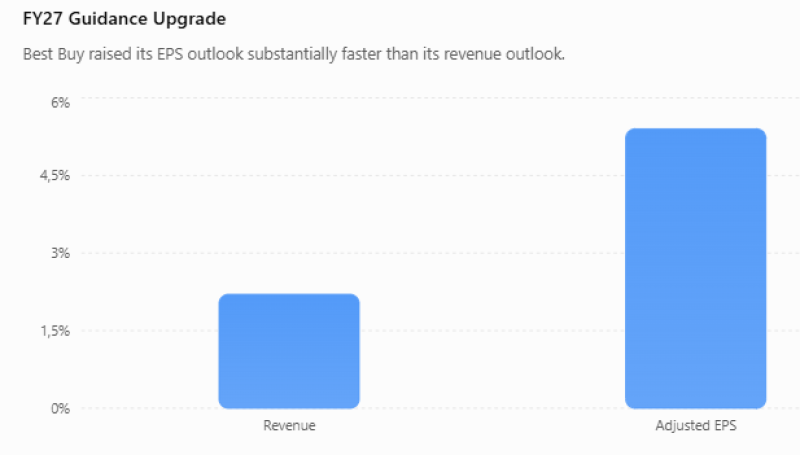
The report shows that the company increases its operating income at a higher rate than its revenue grows.
Q2 Has Already Delivered 21.6% of Full-Year EPS Guidance
The updated instructions permit shareholders to determine the revenue and profit requirements for the remainder of the 2027 fiscal year. With the revised central estimate at $42.55 billion, the second quarter revenue of $9.78 billion is 23.0% of the total annual objective. The second quarter adjusted earnings per share of $1.47 are 21.6% of the revised $6.80 central estimate.
The organization requires about $32.77 billion in sales and $5.33 in adjusted earnings per share during the remaining three business segments to achieve the median target. The two upcoming quarters are significant because the electronics retailer earns more money during the November & December months. There is a tendency for the financial performance to increase as consumers purchase gifts for festivities - but the business must meet those specific financial figures to fulfill its annual projections.
The Guidance Ranges Also Narrowed
The guidance contains an additional point that readers often overlook.
- The old revenue range was approximately $900 million wide: $42.1B − $41.2B = $0.9B
- The new range is only: $42.8B − $42.3B = $0.5B
The analysts calculated that the range of possible outcomes for the predicted income decreased by approximately 44 %. It is the case that the earnings per share reflect this identical trend.
- Previous range: $6.60 − $6.30 = $0.30
- New range: $6.90 − $6.70 = $0.20
The earnings per share guidance range became approximately 33 % smaller. Executives are increasing the predicted values and decreasing the range of those predictions at the same time. It is a more significant indicator of confidence than if they only increased the middle value.
Three Numbers Now Matter
The second quarter financial document is essentially an explanation of three specific connections between data sets.
1. Revenue beat: +2.0%EPS beat: +6.5%
The profits are significantly higher than the unexpected amount of revenue that the company gained from customers.
2. Revenue guidance midpoint: +2.2%EPS guidance midpoint: +5.4%
The managers anticipate that profits are going to increase at a rate that exceeds their predicted growth for revenue.
3. The third section shows that the gross margin is 40 basis points higher than the previous estimate - this outcome results in an additional gross profit that is approximately 39 million dollars.
The gross margin percentage is a significant factor in the calculation of total earnings. The primary financial threat is clear. If Best Buy maintains its gross margin at current percentages and generates revenue that reaches the goal of $42.3 billion to $42.8 billion, the updated target of $6.70 to $6.90 for earnings per share is more likely to be accurate.
If the difference between revenue and costs decreases, the efficiency that showed in the financial results for the second quarter may change back to a lower level in a short amount of time.
 Artem Voloskovets