Marina Lubimova

The weekly chart shows that deeply depressed money flow readings have repeatedly aligned with upward reactions in price. As SmartReversals noted, these signals have appeared consistently since 2000 - with prior bounce points marked across multiple market cycles, including periods of broader weakness.
A Recurring SPX Signal Across Market Cycles
The chart highlights a long-term pattern where extreme lows in the Money Flow Index coincide with upward reactions in price. These moments are not isolated to bull markets - they have also occurred during periods of broader weakness, reinforcing that the signal reflects positioning dynamics rather than trend direction alone.
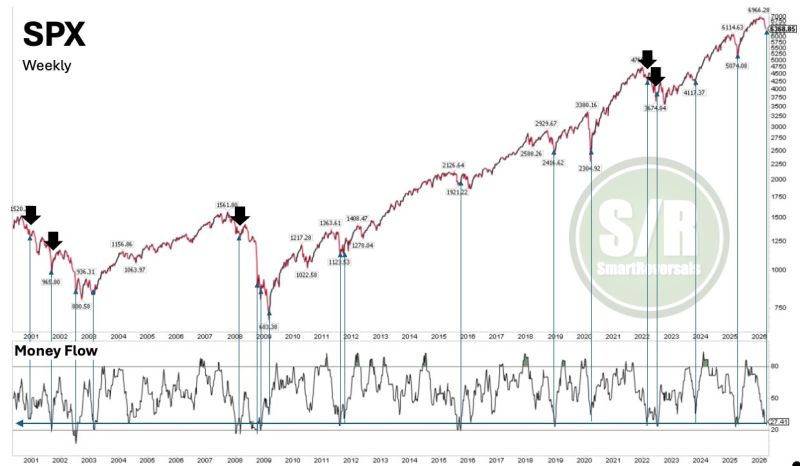
Each marked instance shows how selling pressure reached an extreme before price stabilized and moved higher in the short term. The current reading places the indicator near similar levels seen in past bounce setups.
Relief Moves Do Not Always Mean SPX Reversal
While these signals often lead to upward movement, they do not automatically indicate a lasting bottom. The chart shows that some of these bounces occurred within ongoing downtrends - acting as temporary recoveries rather than full reversals.
At the same time, major bottoms have followed similar conditions as well - including the move highlighted around 2023 - reinforcing that the same signal can precede both short-term relief and more sustained recoveries. The setup alone does not determine the outcome.
Deeply oversold conditions support a bounce - but whether that bounce becomes a reversal depends entirely on what price does after the initial move.
The Condition That Defines a True SPX Structural Shift
The key distinction lies in whether price can recover key averages after the bounce. Without that recovery, the broader structure remains unresolved despite short-term strength.
The current setup places SPX in a familiar position: extreme money flow readings that historically support a tactical move higher, but with confirmation dependent on follow-through. A bounce that fails to reclaim key moving averages would keep the broader structure under pressure - while one that does could mark the beginning of something more meaningful.
 Marina Lubimova