Alex Dudov

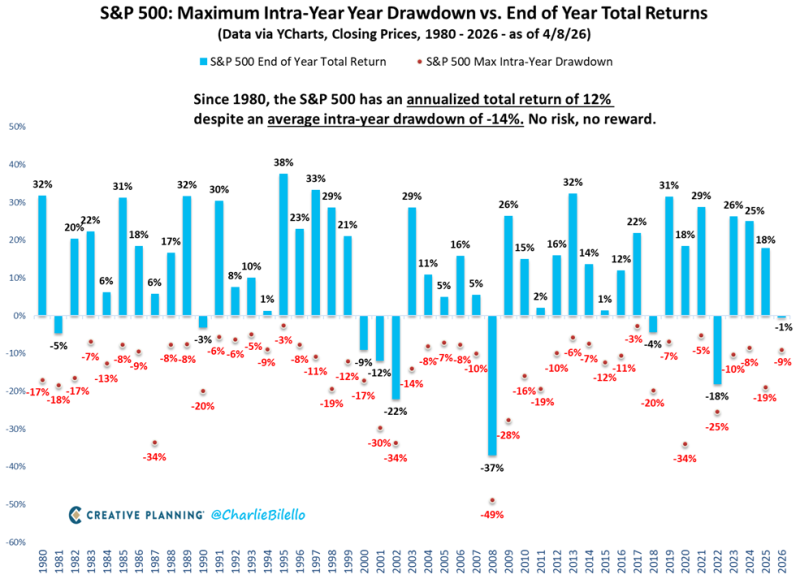
Recent data shows how equity markets function because large gains over long periods often exist alongside price fluctuations that are large and happen over short periods. Since 1980 the S&P 500 has an average return of 12 % for each year. At the same time investors experienced a median decline of 14 % at some point within those same years.
The chart shows the largest price drop of each year next to the final result for that year. It demonstrates that price drops happen frequently and are present even when the year concludes with a higher value.
Volatility is the norm, not the exception
Fluctuations in price are regular events - in most years, the index dropped between 5 % and 15 %. Deeper price reductions occurred during major economic crises. In 2008 the price fell by nearly 49 % and the year ended with a large loss. In 2020 the price dropped by 34 % but the market recovered and the year ended with a positive return. During the early 2000s, the price fell by more than 30 % in multiple different years.
But many of the same years resulted in returns that are high by the time the year ended. It is difficult to predict price changes that happen over short durations.

Positive outcomes despite corrections
Positive results occur even when prices are unstable - returns that are greater than 10 % are frequent. Market prices often increase after they fall quickly. Performance over long durations is persistent.
To conclude the historical record indicates that investors who keep their assets are more likely to gain from growth - this is true even when they must manage through periods where prices are unpredictable.
 Alex Dudov