Artem Voloskovets
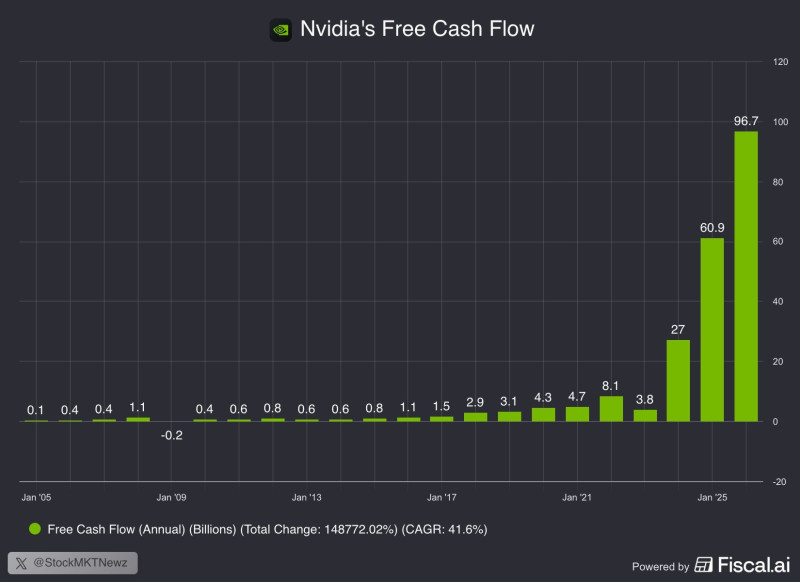
Nvidia's financial profile has undergone a remarkable transformation over the past few years. According to Evanr, the company generated $184.6 billion in free cash flow over the last three years - compared to just $16.6 billion in the three years prior. That kind of step change doesn't happen gradually. It happens when a business hits an inflection point.
NVDA Free Cash Flow: A Long Phase of Steady, Modest Growth
For most of its history, Nvidia's free cash flow remained relatively contained - mostly below $5 billion annually, with occasional dips into negative territory and a slow, unremarkable upward drift. The company was growing, but nothing in that chart suggested what was coming.
This extended phase of modest performance reflects a business building its foundation - investing in architecture, infrastructure, and product cycles that would eventually pay off at scale.
The NVDA Acceleration Phase Nobody Saw Coming
The structure of the chart shifts dramatically in recent years. Free cash flow climbs from single-digit billions to $8.1 billion, dips briefly, then moves sharply higher through $27 billion and $60.9 billion before reaching $96.7 billion in the most recent year.
That sequence is not a gradual ramp. It's a series of step changes - each year materially larger than the last, with no sign of the pace decelerating.
Free cash flow rises from $8.1 billion to $27 billion, $60.9 billion, and finally $96.7 billion - each year a step change in scale
The three-year comparison makes the shift undeniable:
- $184.6 billion in free cash flow over the last three years
- $16.6 billion in the three years before that
That's more than an 11x expansion in cash generation across comparable timeframes.
What the NVDA Free Cash Flow Shift Means for Valuation
Nvidia is no longer a company measured by the same benchmarks that applied just a few years ago. The cash it now generates in a single year exceeds what it produced across entire multi-year stretches not long ago.
This matters for how investors frame valuation. A business operating at $96.7 billion in annual free cash flow sits on a fundamentally different foundation than one at $8 or $10 billion - even if the revenue story looks similar on the surface.
A business operating at $96.7 billion in annual free cash flow sits on a fundamentally different foundation than one at $8 or $10 billion
Market behavior around NVDA has increasingly reflected this shift. Price action and structural expectations have both evolved alongside the changing cash profile - something explored in depth in NVDA pullback mirrors April 2025 structure as 42% correction to $122 comes into question, which examines how consolidation periods interact with these broader fundamental dynamics.
 Artem Voloskovets